We test drive Azure Analysis Services – the good, and the not so good.

Microsoft’s announcement of the release of Azure Analysis Services for SSAS Tabular solutions as a PaaS solution has come at just the right time. See the related article here – https://exposedata.wordpress.com/2016/10/30/old-faithful-is-renewed-welcome-to-cubes-as-a-service/

In the modern world of Advanced Analytics, Semantic Models rather than data warehouses will increasingly play the core role in corporate data landscapes – they are places where data is blended into models that business users can understand, they provide single sources of truth, they can increasingly embrace data from anywhere, they serve as centralised repositories for business rules, they are massively responsive to business change, etc.

In addition, as the business adoption of cloud platforms increase and as they move away from server-based/ Infrastructure as a Service (IaaS) solutions towards Platform as a Service (PaaS) solutions, the greater the need becomes for PaaS based Semantic Models.

But as with most new services and technologies, they can take a while to settle down, so we gave this a few months and now decided to give Azure Analysis Services a proper test drive. In this article, we share our experiences in setting up an Azure Analysis Services solution – we run through its set-up and automation, we provide hints worth sharing, and we discuss the advantages of adopting Azure Analysis Services over its Virtual Machine/ IaaS based siblings.

1         Benefits

Many organizations are moving away from on-premise server-based solutions, some are even trying to avoid IaaS based solutions to meet their Analytical Workloads. This is mostly due to the cost advantages and flexibility associated with PaaS over IaaS and the sheer convenience of support, maintenance, and availability.

But some services in the Microsoft Business Intelligence stack, notably SQL Server Reporting Services (SSRS) for paginated reports, SQL Server Integration Services (SSIS) for batch ETL workloads, Master Data Services (MDS) for Master and Master Reference Data management and until recently SQL Server Analysis Services (SSAS) for semantic model databases, could only be deployed as Virtual Machine/ IaaS or server-based solutions.

HINT: Please also note that some of the other IaaS based services are on a current and imminent PaaS roadmap, so we should hopefully see some more PaaS versions of previous IaaS only services. Please make sure you bear this in mind when planning your environments.

Azure Analysis Services is available in the Australian Regions (Australia East and Australia South East) so for me often having to deal with questions around data sovereignty, Azure Analysis Services, and its underlying storage as Storage Accounts, both being local, therefore presents no data sovereignty issues at all. By the way – most major regions worldwide are now supported.

It ties in nicely with dev ops processes. It is for example much more responsive to changing business needs such as responding to unforeseen usage trends, without the need to manage VM’s.

There are obvious cost benefits. The PaaS model for Azure Analysis Services means that the solution can be scaled up or down to meet varying workload requirements, and even paused when not used. This all means a much more flexible PAYG cost model.

There are no new dev technologies or skills required. The solutions are still created using Visual Studio (SSDT templates), it is still managed and monitored through SQL Server Management Studio (SSMS), and it is still deployed in a similar way as before. There are however some deployment gotchas and automation pitfalls, but these can be easily overcome. We discuss these later in this article.

Power BI will find it much simpler to connect to Azure Analysis Services as it need not worry about an Enterprise Gateway. This makes for an even simpler architecture.

Below are our test drive results for Azure Analysis Services. We assessed it through the following criteria:

·       How easy is it to set up the service?

·       What about the development experience?

·       What does deployment look like?

·       How easy is it to actually access and use it?

·       Are there any operationalize pitfalls? We step through how to overcome these.

Say “hello Azure Analysis Services!”

2       Set up

Set up was really easy – you select a name, resource group, location, administrator (a named user from your AAD tenancy), and a pricing tier.

1 setup

HINT: The pricing tier comes in Developer, Basic and Standard options. Our suggestion is to opt for the Developer tier for evaluation, dev and test purposes and then to advance to either basic or standard for production depending on whether Perspectives, Multiple Partitions, and Direct Query mode were used during the development cycle.

1 setup 2

https://azure.microsoft.com/en-au/pricing/details/analysis-services/

The most basic Developer tier (D0) will equate to approx. $126 (AUD) per month if run 24 x 7, based on standard Microsoft pricing as at the date of this article.

Administrators can pause and resume the server as required. There are no charges whilst the server is paused. The developer cost quoted is, therefore, worst case scenario for this tier.

In addition, Azure Analysis Services use very cost effective Azure Storage Accounts as its primary storage mechanism.

HINT: We suggest to select the same location for the storage account as was selected for the Azure Analysis Services for performance reasons. We selected Australia South East.

3       Development

Azure Analysis Services uses the same development regime as SSAS Tabular, it’s only the deployment that is different. So, there should be no issues as long as you know your way around SSDT.

2 Dev

Developers can use SQL Server Data Tools in Visual Studio for creating models and deploying them to the service. Administrators can manage the models using SQL Server Management Studio and investigate issues using SQL Server Profiler.

HINT: Make sure you have the latest version of SSMS and SSDT otherwise you may run into trouble:

https://docs.microsoft.com/en-au/sql/ssms/download-sql-server-management-studio-ssms

https://docs.microsoft.com/en-au/sql/ssdt/download-sql-server-data-tools-ssdt

4       Deploy

Deployment can be tricky, but nothing too severe that cannot easily be overcome. Deployment is in theory very straightforward, but we suspect most people may run into compatibility level problems – we fall into that trap. We think it’s safe to say most people will still be using SQL Server 2012 or 2014. This requires some upgrades before you can deploy to Azure Analysis Services.

3 Deplpy

4.1      Ensure a consistent compatibility level

HINT: Deployment to Azure Analysis Services will only work at a compatibility level of 1200 or higher. Therefore (as in my case) upgrade the local version of SQL Server (or whatever is used as the workspace server) from 2014 to 2016.

HINT: Ensure Visual Studio also uses the correct compatibility level.

When we initially created the Visual Studio solution we would have selected a compatibility mode and quite likely “Do not show this message again”.

3 Deplpy 2

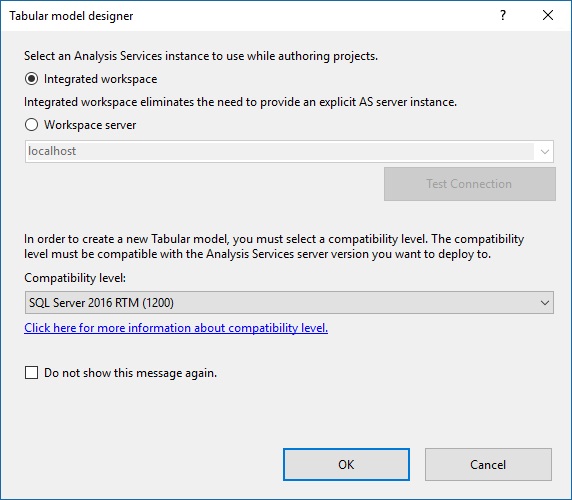
This means that all of our projects will have defaulted to the compatibility level we originally specified (1103). To change this, we had to log into the Tabular database in SSDT, then select Tools > Options. We then had to set the compatibility level as per below.

3 Deplpy 3

HINT: Keep in mind, upgrading the compatibility level is irreversible.

4.2      Actual deployment

  • Right-click the project
  • Select properties
  • Alter your Server, the database, and the model name
  • Click apply

3 Deplpy 4

Back in your project

  • Right-click the project
  • Select Deploy
  • Log in to your subscription
  • The Deployment should now start and hopefully complete without errors

5       Using the Azure Analysis Services Model

You may want to connect to your new Azure Analysis Services cube via SQL Server Management Studio (SSMS) or via a reporting tool such as Power BI or Excel.

All of these mechanisms proved to be seamless and simple as long as you are familiar with accessing IaaS or on premise-based SSAS Tabular databases. The fact that no Enterprise Gateway complications exist also makes using PaaS for Azure Analysis Services a very compelling option.

4 Use

5.1      SSMS

We opted for Active Directory Password Authentication.

4 Use 2

Browsing the Tabular database was exactly the same as the IaaS or on premise-based equivalent. We found performance to be pretty good too, even at the D0 tier.

4 Use 3

5.2         Power BI

The connection to Azure Analysis Services is found under the Azure section of the Get Data functionality.

4 Use 4

We opted for Live Connection, i.e. allow the data to remain in Azure Analysis Services rather than bring it into Power BI.

4 Use 5

Simple log in using my Organisational account

And we’re in!

4 Use 6

5.3         Other

Other 3rd party BI tools can also connect to Azure Analysis Services. This article, for example, discusses connections from Tableau.

https://azure.microsoft.com/en-au/blog/connect-tableau-to-an-azure-analysis-services-server/

6       Operationalise, Processing and other management tasks

You can, of course, process your Tabular database through SSMS manually, but in this section, we are automating that process on a scheduled basis. This can still be achieved via ETL, but as we are highlighting a PaaS solution here, we are limiting this discussion to PaaS only (SSIS still at the date of authoring of this article still an IaaS service only).

This automation has proved to be the most difficult of all criteria assessed. It is however relatively simple once it’s up and running, but it took quite a bit of effort to get to that point.

Our lower rating here is therefore not so much a judgement on Azure Analysis Services, but on Azure’s overall Automation regime, which is still very code-heavy and, in our opinion, not as nicely integrated and mature as other services’ integration, for example, the integration between Azure Event Hubs and Azure Stream Analytics.

5 Oper

In the sections below, we step you through how to automate the processing of Azure Analysis Services.

6.1      Azure Functions

In order to Automate Azure Analysis Services, it’s important to understand Azure Functions. Azure functions enable us to run small pieces of code, and it allows for this code to run without having to worry about an application or infrastructure to run the application. It also gives us the choice of various development languages (C#, F#, Node.js, Python, and PHP). In the following we list some of the key features of Azure functions:

HINT: Azure Functions come in two pricing plans as:

“Consumption plan – When your function runs, Azure provides all the necessary computational resources. You don’t have to worry about resource management, and you only pay for the time that your code runs.

App Service plan – Run your functions just like your web, mobile, and API apps. When you are already using App Service for your other applications, you can run your functions on the same plan at no additional cost.”

https://docs.microsoft.com/en-us/azure/azure-functions/functions-overview

6.2      Automating the scheduled processing of Azure Analysis Service using Azure Functions

In this section, we will walk you through how to use Azure Functions to trigger the processing the Azure Analysis Services database or tables.

6.2.1        Create the Azure Function

5 Oper 2

After creating new function app, open the app and choose “Timer” with “CSharp” language to create a new function:

5 Oper 3

6.2.2       Set up the Timer

Click on Integrate and select the Timestamp parameter name and schedule. In this example, we set the schedule to trigger the function every 8 hours.

5 Oper 4

6.2.3        Function App Configuration Setting

To run the Azure analysis service, upload the following files to the existing function. These files can be found from your local computer.

HINT: Make sure you have the latest data providers installed on your computers.

To get more info and download the latest data (if not available on your local computer) please see https://docs.microsoft.com/en-us/azure/analysis-services/analysis-services-data-providers

C:\Windows\Microsoft.NET\assembly\GAC_MSIL\Microsoft.AnalysisServices.Core\ Microsoft.AnalysisServices.Core.DLL

C:\Windows\Microsoft.NET\assembly\GAC_MSIL\Microsoft.AnalysisServices.Tabular\Microsoft.AnalysisServices.Tabular.DLL

The triggering function needs to use the above files. To load them into the app, click on function app> Platform features> Advanced tools (Kudu)

5 Oper 5

In a new window, select Debug Console>CMD. Navigate to “bin” folder and load the files into it.

5 Oper 6

6.2.4        Set up the Connection Strings

To set the connection string, select Platform features>Application settings:

5 Oper 7

Fill the connection string values as “name”, “value” and “SQL server”. The “name” will be used in your C# code. The “value” can be selected from SSAS server overview page:

5 Oper 8

5 Oper 9

6.2.5        Add the code

HINT: Remember to change the Run function input, Connection string, database and table names based on your model.

5 Oper 10

https://azure.microsoft.com/en-au/blog/automating-azure-analysis-services-processing-with-azure-functions/

Click Save and Run. You should see the following logs:

5 Oper 11

Voila!


Contributors: Etienne Oosthuysen, Shaun Poursoltan

Important Power BI news release

Power BI News

Starting June 1, 2017, Microsoft is making some changes to the way Power BI is licensed, there are also some important changes to the Power BI Service. So if you use Power BI, or intend to use Power BI, please be aware of these changes.

Exposé has been at the forefront of the Power BI revolution and we view these changes as even more positive steps towards a cost-effective, scalable and maturing BI and Analytics platform. We found that organizations really benefit from some guidance on the administration side of Power BI. If you’d like further advice on these changes or assistance with this transition and how it affects you and your organization, please don’t hesitate to get in touch.

Here are the changes:

Power BI free tier

Microsoft is now giving all free tier users the following capabilities:

  • ability to connect to all of the data sources that Pro users can connect to
  • a storage quota increase from 1GB to 10GB
  • data refresh maximum from once daily to once hourly
  • streaming data rates from ten thousand rows per hour to one million rows per hour

But in doing this they will be removing the following capabilities:

  • sharing reports and dashboards with other users
  • using group workspaces (now to be called app workspaces)
  • export to PowerPoint, CSV, Excel
  • analyze in Excel

This makes the licensing of the free tier truly for personal use only as all private sharing capabilities are now no longer available within the Power BI free license.

To help ease the transition to the new licensing model, Microsoft is allowing people who have had a license with the Power BI service on or before May 2, 2017 and have at least signed in once between May 2, 2016 and May 2, 2017 to apply for an extended trial of a Power BI Pro license. This license will enable the use of all Power BI Pro features until May 31, 2018. If you meet these requirements you will be sent an email from MS and will also have a notification appear when you log in to the service.

If you require an organizational use of Power BI, you will now either need to license all users for Power BI Pro or their new tier, Power BI Premium.

Power BI Premium

Power BI Premium is a new capacity-based licensing model coming late in the second quarter of 2017. It allows organizations to acquire only Power BI Pro licenses for report creators and the rest of the organization to consume these reports and dashboards without having to purchase a Pro license.

The charging model for this is based on a Premium node within the Azure environment that can be scaled according to an organizations performance requirements. Microsoft has provided a calculator service here to help estimate costs.

Power BI Report Server

Coming late in the second quarter of 2017, Microsoft will be offering the capability to publish Power BI reports on-premise using Power BI Report Server.

The on-premises server will allow the deployment and distribution of interactive Power BI reports and traditional paginated reports within the boundaries of an organization’s firewall.

To enable the use of Power BI Report Server, you will need to either be licensed under Power BI Premium or have a per-core license of SQL Server Enterprise Edition with Software Assurance.

Power BI Apps

Power BI content packs are changing to become known as Power BI apps.

At the moment, there won’t be a large difference between apps and content packs, mostly a change in interface and publishing process. But Microsoft has a roadmap for improvement under the new app model.

They are planning the following enhancements to app workspaces in the coming months:

  • Creating app workspaces will not create corresponding entities in O365 like group workspaces do. So you can create any number of app workspaces without worrying about different O365 groups being created behind the scene (you can still use an O365 group’s OneDrive for business to store your files).
  • Today you can add only individuals to the members and admin lists. In the next iteration, you will be able to add multiple AD security groups or modern groups to these lists to allow for easier management.

The impact, for now, is that Microsoft will rename all group workspaces to app workspaces and you can publish an app from any of these workspaces.

Power BI Embedded

Microsoft has also announced the convergence of the Power BI Embedded service with the Power BI service. This means that there will be one Power BI API that will have feature parity with the current Power Embedded service and so any existing apps built using Embedded today should continue to function but you will be required to prepare for migration over to the new service.

Power BI Service Interface

Finally, and for those who may not have been aware, Microsoft has been trialling a new interface for the Power BI service over the past few months. As of May, this interface will become the default. I’d recommend taking some time to understand what the new interface is like as there are some large changes to what you may be used to in relation to your workflow.

From operational challenges to a modern, automated and simplified organisation – Our Business SA case study

An Exposé case study around our advanced analytics solution for the ‘voice of business in South Australia’,  Business SA. The solution was an important component of a large digital transformation program that saw Business SA transition to a modern, automated and simplified organization which was underpinned by the following technology changes;

• A cloud-first strategy which reduced Business SA’s dependence on resources that provided no market differentiation
• Simplified the technology landscape with a few core systems which performed specific functions
• Established a modular architecture which is more able to accommodate change
• Implemented a digital strategy to support an automated, self-service and 24/7 service delivery
• Improve data quality through simpler and more intuitive means of data entry and validation
• Utilise the latest desktop productivity tools providing instant mobility capabilities

See the full case study here: Data and Analyticsexposé case study – Business-SA

Artificial Intelligence in Advanced Analytics Platforms

artificial intelligence

Artificial intelligence (AI) encompasses various technologies such as machine learning, natural language processing, deep learning, cognition, and machine reasoning. Usually, AI is defined as a biological system which is designed for computers to give them the human-like ability of hearing, seeing, thinking and then reasoning. One of the newest technology applications in businesses, Computer Vision, is an AI field that deals with how computers can be made to gain a high-level understanding of images and videos. The sub-domains of Computer Vision are video tracking, object recognition, learning, motion estimation, image restoration, etc.

According to a survey conducted by Narrative Science, 0% of businesses already use AI in some form or another, a figure set to increase at over 60% by the end of 2018.

Let’s look at a typical use case we are working on right now, after which we will compare the two exciting entrants into the area of Computer Vision.

Use case:

Marketing activities are centred around smart advertising in online platforms. The business wants to change the advertising to be based on a person’s demographics such as race, gender, and age which can increase the benefits for the company placing the advertising advertisement.

Related use cases (especially around emotion) is discussed in the short video blog here: https://exposedata.wordpress.com/2017/01/12/cognitive-intelligence-meets-advanced-analytics/

Two platforms compared:

The two emerging major services set to disrupt the  Computer Vision market are Microsoft Cognitive Intelligence and Amazon (AWS) Recognition. These services aim to place AI such as Computer Vision services in the hands of analytics developers or analysis by providing APIs/ SDKs which can easily integrate into applications by simply writing a few lines of code. The added benefit is the integration with their larger cloud-based offering which gives the businesses a quicker ROI, higher reliability, and lower cost.

Let’s have a look at Microsoft’s Cognitive Intelligence and Amazon’s Recognition based Object Identification, Text Recognition, Face Detection, Emotion (in depth) and Price.

Object Identification:

Amazon and Microsoft both provide APIs and SDKs to read, analyze and label various objects in images. Both Microsoft and Amazon services could identify and label the objects included in the uploaded image (with a calculated level of confidence as shown). However, Microsoft can also analyze videos in real time in addition to images. Figure 1 and 2 show the results of both platforms respectively.

1

Figure 1: Microsoft object identification results

2

Figure 2: Amazon object identification results

If you need to process videos, then Microsoft Cognitive Intelligence provides the superior service. It can also detect adult content and image or video category. However, if you are using images only, both products step up to the plate very well.

Text Recognition:

Similar to object Identification, we conducted a test to analyze images that include text. Unfortunately, Amazon doesn’t yet provide a full-text recognition service. The Microsoft offering can find, analyze and write back text in different languages. Figure 3 and 4 present the results by Microsoft and Amazon after analyzing the texts included in uploaded images.

3

Figure 3: Microsoft Text Recognition Result

4

Figure 4: Amazon Text Recognition Results

If you need to analyse text within images, the Microsoft service is at present the only option.  Amazon only shows that the uploaded image has text whereas Microsoft shows the actual text (even from multiple languages).

Face Detection:

One of the main applications of Computer Vision in AI is face detection. This can be extended to finding human demographics such as gender, age, emotion, wearing glasses, facial hair, ethnicity, etc. Figure 5 and 6 show our results.

5

Figure 5: Microsoft Face Detection6

Figure 6: Amazon Face Detection

Both Microsoft and Amazon have the ability to find demographic information such as gender, age, whether they are wearing glasses or not, having a beard, etc. Microsoft goes one step further as faces can be grouped into visual similarity (such as verifying that two given faces belong to the same person). In addition, Microsoft can process real-time videos of people.

Emotion in Depth:

Computer Vision analyses a person’s emotion by studying his/her face. It returns anger, sadness, contempt, disgust, fear, happiness, neutral and surprise percentages.

7

Figure 7 Microsoft Emotion in Depth

If a business requires the analysis of someone’s emotion then Microsoft can analyze and measure each of the emotions listed above based on faces. Amazon only returns the percentage of detected smiles. Also, Microsoft can process both images and real-time videos.

Service Price:

This is not a quote but highlighting the simple cost comparisons as obtained from the respective Microsoft and Amazon pricing websites:

For Object Identification and Text Recognition, Amazon is priced at $1.00 per 1000 images, compared to Microsoft’s $1.50 per 1000 images.

For Demographic Recognition (e.g. gender, age, wearing glasses, etc.),  Amazon is priced at $1.00 per 1000 images. Microsoft has a free plan if the number of calls is less than 30,000 per month, and above that, prices vary from $1.50 to $0.65 based on the number of calls.  In addition, Emotion “in depth” has its own prices at $0.10 per 1000 calls.

Amazon Recognition (all services): https://Amazon.Amazon.com/rekognition/pricing/

Microsoft object and text identification: https://www.microsoft.com/cognitive-services/en-us/computer-vision-api

Microsoft face detection: https://www.microsoft.com/cognitive-services/en-us/face-api

Microsoft emotion in depth: https://www.microsoft.com/cognitive-services/en-us/emotion-api

Summary of services:

The following table provides a summary of Computer Vision services between Microsoft and Amazon (at the time of authoring of this article).

t1

Conclusion:

Although Microsoft’s Computer Vision is in some areas more mature compared to the Amazon equivalent, it must be noted that Amazon’s Computer Vision services are much newer compared to Microsoft’s equivalent. We have seen a lot of investment by both vendors in this area, so expect Amazon to close the gaps in due course.  However, at the time of writing this, Microsoft is certainly leading the pack in Computer Vision.  But watch this space. 

Power BI and SharePoint Online – together at last!

Microsoft recently released a feature to enable organizations to easily insert Power BI reports into their SharePoint Online pages.

In his blog post Senior Program Manager, Lukasz Pawlowski, identified that the new web part for SharePoint Online will enable the addition of Power BI reports without requiring any coding by SharePoint authors.

The way the feature will work is simple.

  1. Publish your Power BI report to your Power BI service account
  2. Get the URL to the report from the File menu in Power BI service
  3. Add the Power BI (preview) web part to your SharePoint Online page
  4. Paste the URL of the report when prompted
  5. To finish, save and publish your page

This new feature is currently in preview and is only available to Office 365 tenancies that are set to “First Release” as it uses a new authentication method that has only been made available to First Release tenancies. This authentication will allow users to see reports based on their organization authentication without having to sign in again.

The use of this new feature requires users to have a Power BI Pro license as well.

Further details on how to use this new feature have been provided by Microsoft here.

Power BI Service Updates

Microsoft recently released an announcement highlighting changes that had been made to the Power BI service environment. These included:

Power BI admin role

–          An O365 admin can now assign a Power BI admin who will have access to tenant-wide usage metrics, and be able to control tenant-wide usage of Power BI features.

Power BI audit logs globally available

–          In public preview are audit logs for Power BI to enable admins to track usage of the platform

Public preview: Email subscriptions

–          Power BI will regularly send screenshots of a subscribed report page directly to your inbox whenever the data changes and a link back

New APIs available for custom visuals developers

Real-time streaming generally available

–          Real-time streaming has moved from preview to general availability. This allows users to easily stream data to Power BI via the REST API, Azure Stream Analytics, or PubNub

Push rows of data to Power BI using Flow

–          Power BI Flow connector which pushes rows of data to a Power BI streaming dataset without writing a single line of code

New Microsoft Azure AD content pack

–          A new content pack for Microsoft Azure Active Directory to quickly visualize how it is being used within an organization.

Further details can be found here: http://bit.ly/2lwYHsu